Why the Neglected US Small-Caps Market Now Appeals
Posted by bedrock on
Executive Summary
After years of lacklustre performance, US small-caps look attractively valued both on a historical basis and relative to US large-caps. In fact, on some measures, US small caps currently trade at the largest discounts relative to US large-caps since the dot-com bubble.
Several factors have contributed to small-cap underperformance, including (1) a decline in the average quality of companies included in small-cap indexes, (2) the greater rate sensitivity of small-cap stocks during a period of tighter monetary policy, and (3) muted M&A activity, which otherwise tends to benefit small-caps disproportionately (as small-caps are more often targets for acquisition).
Nevertheless, there may be light at the end of the tunnel for investors in US small-caps.
Rates in the US have started to decline (albeit slowly), and this should herald a more supportive macroeconomic environment in the coming months and years.
At the same time, domestic economic activity in the US is proving far more resilient to tight monetary policy and a challenging external environment than in developed market peers, presenting a tailwind for (more domestic demand dependent) small caps
And, finally, there is evidence that M&A activity is returning to ‘normal’ (higher) levels.
In light of the above and the relative cheapness of US small caps, making an investment in this asset class today as part of a diversified equity allocation looks appealing.
Finally, given the diversity of business models in the US small-cap universe, the lower efficiency of the US small-cap stock market (relative to the large-cap stock market), and the large number of companies with low quality earnings in US small-cap indices, we believe that this is one asset class where taking an active management approach can add considerable value.
Large-cap chasing investors have left small-caps behind
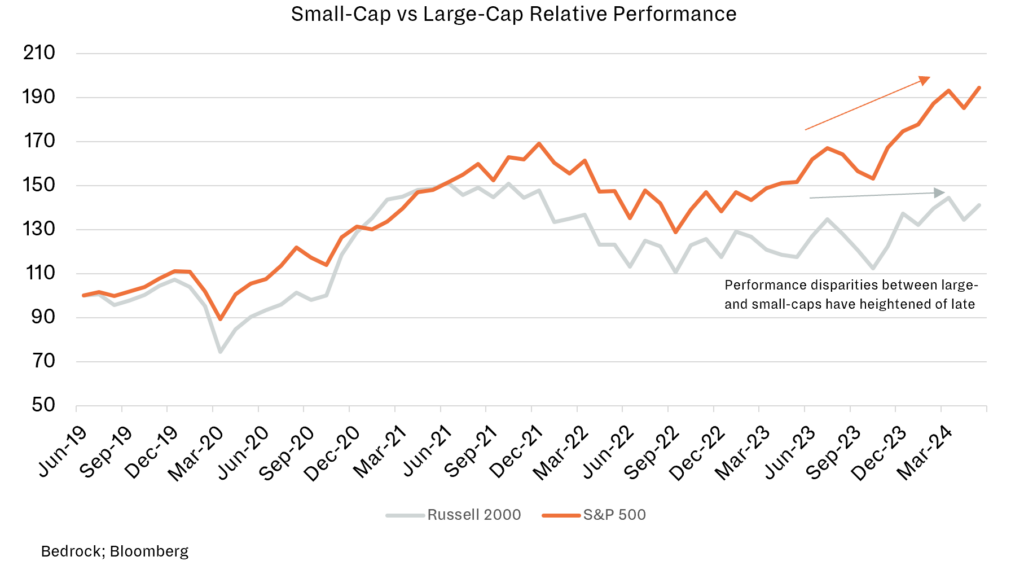
With investors more drawn to large-caps in recent years, small-cap stocks have lagged. With this year’s irresistible Big Tech momentum, the trend has only accelerated.
‘Small-cap’ stocks – generally considered those with $250mn to $2bn market capitalisations – outnumber their bigger cousins, like the more familiar large-cap constituents of the S&P 500 (all of which have market capitalisations >$15bn). But they tend to attract much less attention from short-term traders and sell-side analysts, meaning less readily available information about them. This translates into a much broader but less efficient market, arguably in which mispriced opportunities can be more reliably found by knowledgeable fundamentally-driven investors.
However, small-cap stocks have struggled to keep pace with large-caps in recent years – and the gap has only widened with this year’s narrow, Big-Tech driven rally. The Russell 2000, an index of 2000 smaller companies listed in the US, has lagged the S&P 500 in each of the past seven years, except 2020. In the first five months of this year, the same index has posted a return of just +2.7% compared to +11.3% for the S&P 500.
It’s not always been this way
History suggests small-caps are typically more rewarding – and the recent aberration could end.
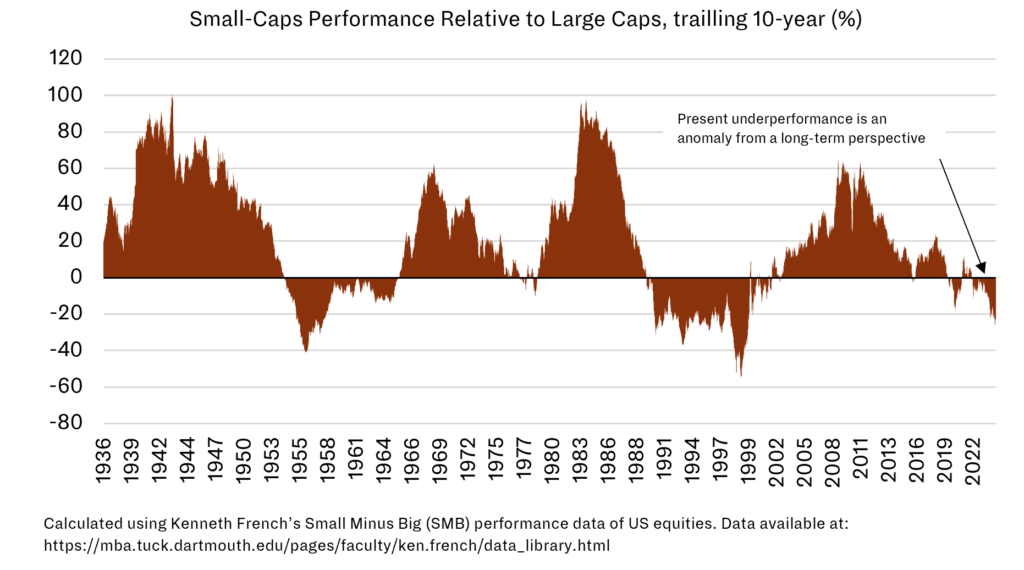
Nevertheless, from an historical perspective, this spell of US small-cap underperformance is unusual. According to influential academics Fama and French, US small-caps have outperformed US large-caps by 285 basis points per year on average since 1926 (the earliest date for which this dataset is available). They have also posted positive trailing 10-year returns for more than two-thirds of the same period.
The abnormality of the current spell of underperformance is visible in the following graph, which shows Fama and French’s data on the long-term relative performance of US small- and large-caps. The graph also illustrates the tendency of small-caps to rebound from periods of weakness. On average, over the period shown, extended episodes of small-cap weakness were followed by outperformance of 22 percentage points, 11 percentage points, and 10 percentage points in the subsequent 1, 3 and 5 years respectively.
Bargains to be had
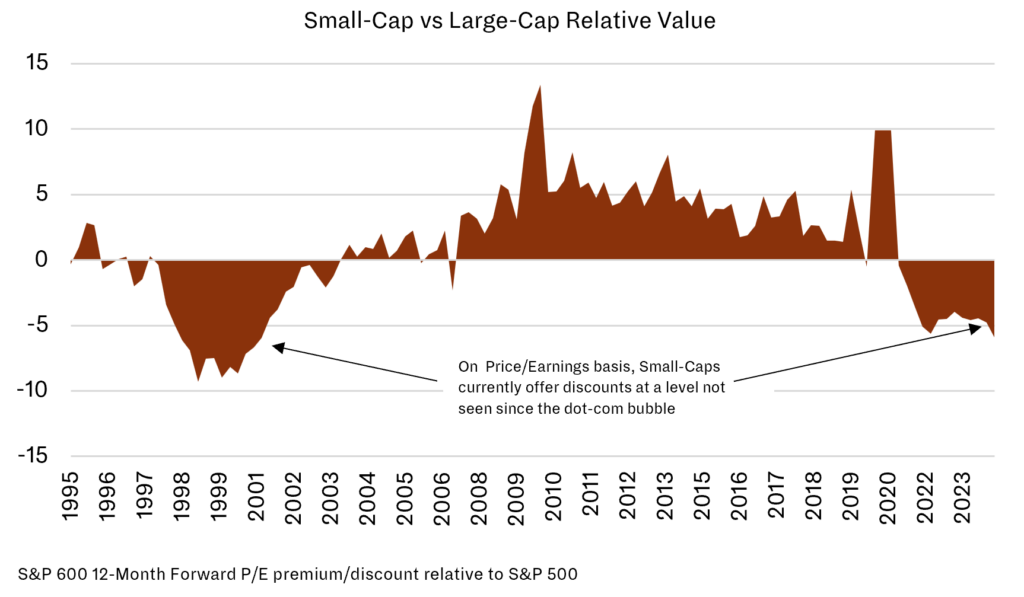
Small-cap valuations now look appealing, compared both to their own past averages and to soaring large-cap valuations – setting up a compelling relative value opportunity.
The recent divergence of performance between small-caps and large-caps has also now resulted in a large disparity of valuations. While large caps have become historically expensive (in terms of P/Es, for example), small-caps are relatively cheap compared to their historical averages. The S&P 600 Index – which is another index of smaller US-listed companies, but which is considered ‘higher quality’ than the Russell 2000 as it has fewer constituents with negative earnings – is currently trading at a 30% discount to the S&P 500 in terms of Forward P/Es (at 14x vs. 20x). This is close to record cheap levels.
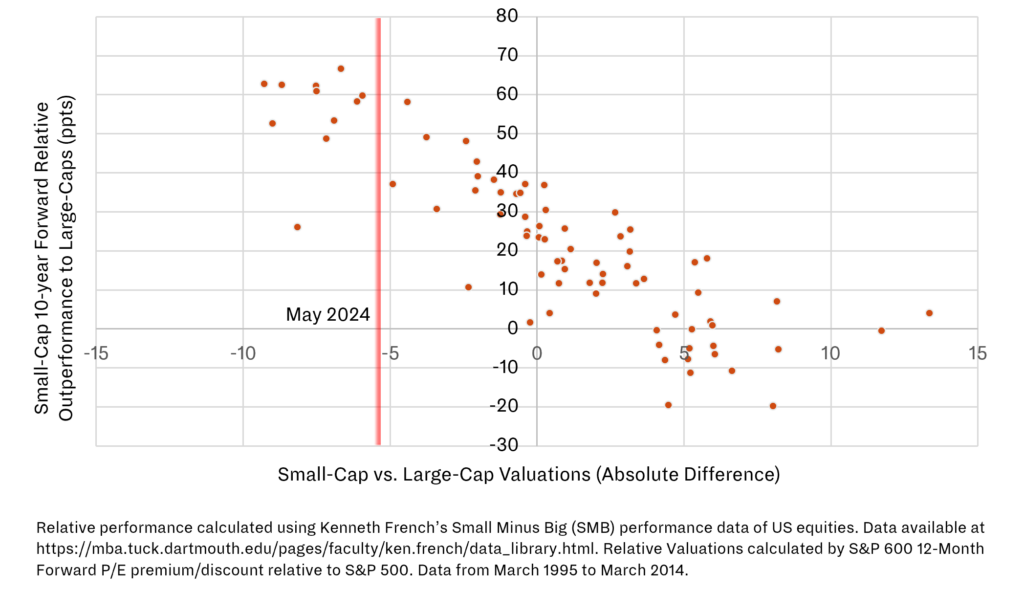
If and when the current underperformance cycle ends and small-caps pick up the momentum necessary to close this valuation gap, investors with above-benchmark exposure to US small-cap equities will be rewarded. Therefore, the present moment could well represent an appealing entry point.
Why have small-caps fallen behind?
The headwinds holding small caps back range from stagnant margins to sensitivity to higher interest rates and softer M&A action.
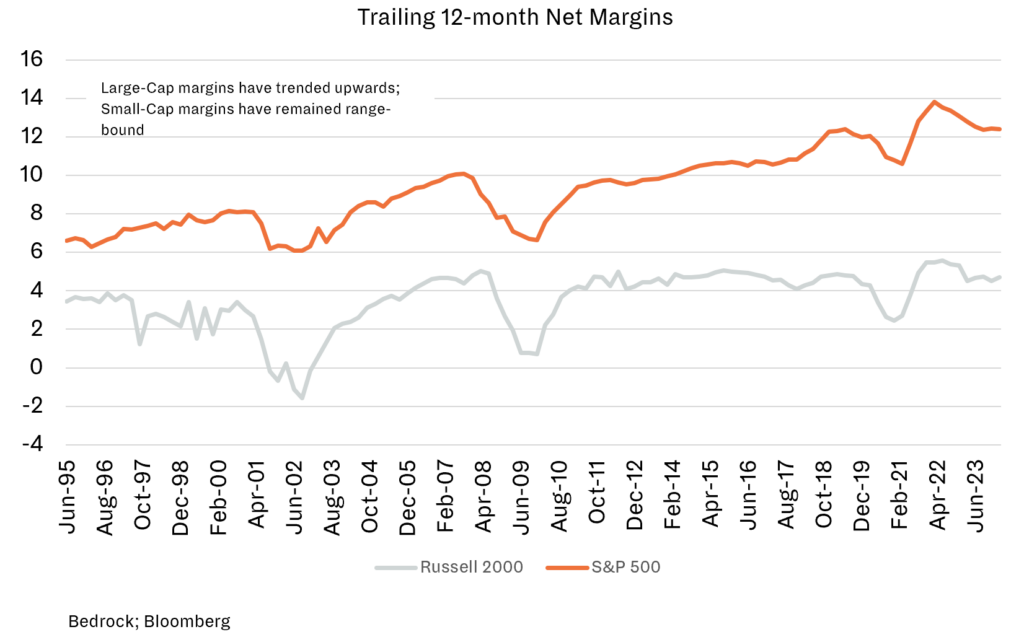
One commonly cited reason for the small-cap/large-cap valuation gap is a divergence in the underlying quality of companies in the respective universes. While US large caps’ net margins have steadily grown over the past several decades, small-cap margins have remained range-bound. Indeed, small-caps’ margins have remained tightly tied to the business cycle (without a clear upward trend reaching across multiple cycles), reflecting small-caps’ greater economic sensitivity. This means that small-cap stocks tend to perform less well when growth slows and recession bells ring – and contributes to unease about the segment in the current, uncertain macroeconomic environment.
Alongside stagnant margins, the share of negative-earning companies in small-cap indexes has also grown meaningfully in the last several years. Non-earners now represent c.40% of the Russell 2000, significantly higher than both the index’s average since its inception in 1984 and the current equivalent figure for the S&P 500 (<10%). Negative earners tend to cap the aggregate upside of small-cap indexes, and this headwind has only grown since the SPAC boom of 2020-2021, when the proportion of negative-earners in the likes of the Russell 2000 expand greatly.
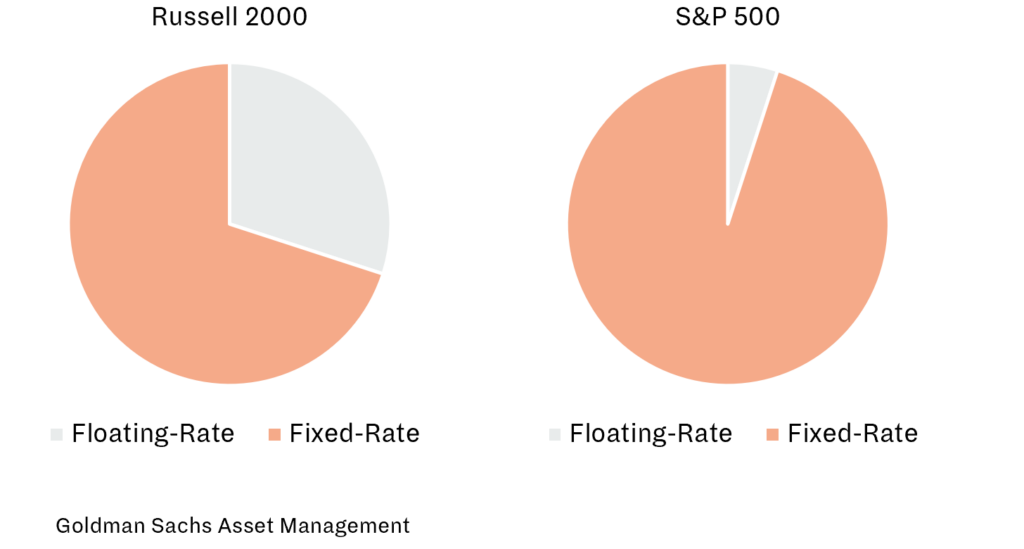
High and rising rates have also played a pivotal role in small-caps’ underperformance since the start of the Fed’s current hiking cycle in 2022. Overall, small-cap companies are more sensitive to interest rates than large-caps because they are, on average, more leveraged. The average Net Debt/EBITDA for companies in the Russell 2000, for example, is 3.2x, versus 1.6x for the S&P 500. In addition, debt interest payments made by small-cap companies are much more often directly related to the current level of policy rates (c.30% of Russell 2000 companies’ debt is ‘floating-rate’, as it is known, compared to c.6% for the S&P 500.) Rising rates therefore impact smaller companies’ balance sheets more quickly than larger companies’ balance sheets, and this has harmed the relative performance of small-caps in the recent period of monetary tightening.
Finally, a lull in M&A activity has also dragged on small cap performance. Smaller companies are often targets for strategic acquisitions or for take-private transactions (in which investors pay, on average, a 35% premium to the prevailing share price). Historically, this has provided an important bid for small-cap stocks. But M&A activity has remained well below its historical average level since 2021, and the impact on small-cap stocks has been felt.
But the wind can turn
However, there are reasons for optimism about US small-cap performance as headwinds abate and a changing macroeconomic environment becomes more supportive.
With US inflation trending down, the Fed is poised to cut policy rates. This should be a boon for small-cap stocks for several reasons. Firstly, being on average more reliant on floating-rate debt, their balance sheets should improve faster than those of large-caps as rates are cut, catalysing price appreciation. Secondly, small-cap companies often experience higher growth rates than large-caps. This makes them more sensitive to how investors value their (larger) future cash flows, in particular via the discount rate applied to those future flows. (Discount rates are directly related to sovereign bond rates, in turn shaped by central bank policy. As policy rates fall, so do discount rates, magnifying the discounted present value of fast growing small-cap stocks.) Historical data supports this view. Small-caps have tended to outperform large-caps in the 12 months after the Fed Funds Rate peaks, whatever happens to the ‘real economy’.
US small-caps are generally more sensitive to domestic US demand, which may benefit performance going forward if the US economy continues to outperform large economy peers in Europe and Asia. Russell 2000 constituents generate c.90% of their revenues from inside the US, compared to c.60% of revenues for the ‘global corporate’ constituents of the S&P 500. Morningstar data shows that the Russell 2000 has soared +25.2% per annum in periods of accelerating growth and slowing inflation, compared to +17.3% for the S&P 500. Small caps should hence be well-placed to benefit from policies aimed at boosting domestic activity, such as the Inflation Reduction Act and the associated efforts by corporates to ‘re-shore’ production and supply chains.
The US M&A market is also starting to show signs of life once more, offering another possible boost to small-caps. M&A transaction volumes were up +30% globally in Q1 2024 versus the same period a year earlier and US M&A transaction volumes surged +59% over the same period, supported by increasing CEO confidence amid US economic resilience.
Although uncertainty ahead of the US Presidential election clouds the domestic economic outlook to an extent, small-caps have historically fared well following elections, as incoming Administrations seek to consolidate their standing by boosting the domestic economy. The Russell 2000 has outperformed the S&P 500 in both the 6- and 12-month periods following US elections, on average, since 1980. This suggests that an allocation to small-caps could prove useful in the months ahead.
Get active
The small-cap universe’s diversity and relative inefficiency suggest that there may be benefits to active management in small-cap stock selection.
The particular characteristics of small-cap stocks and indices suggest an actively managed investment strategy may be more appealing than a passive, index-tracking approach in this market segment. Most small-cap companies are less liquid, are covered by few if any sell-side analysts, and there is less easily-accessible information about them online. As a result, small-cap stocks are less price efficient than large-caps and more likely to be mispriced for extended periods of time.
Moreover, some small-caps are best avoided. Many have low earnings and/or high leverage (indeed, half of the Russell 2000’s debt is held by just 10% of its constituents). This makes this subset of stocks very sensitive to rates and volatile to hold. At the same time, some but not all ‘negative-earners’ have limited potential upside. These risky pockets can be avoided by an active manager more effectively than by using a passive index-tracking approach. At the same time, an active manager is better placed to capitalise on the pockets most likely to benefit from the tailwinds for the asset class outlined above (e.g., selecting potential acquisition targets).
Finally, an allocation to small-caps is likely to have portfolio diversification benefits (which is of particular value now following the run-up in US large-caps that we have seen). Portfolios of small-cap stocks generally offer investors meaningful sectoral diversification thanks to the domestic-economy linkages of many small-cap companies (and the notable absence of multi-national tech companies that dominate large-cap indices). As a result, a small-cap allocation can sit comfortably alongside large-cap allocations in portfolios, offering complementary characteristics across the business cycle.
If you have any questions about the themes discussed in this article, please do not hesitate to get in contact with us at info@bedrockgroup.ch
Authored by:
Important Legal Information
The content of this document has been prepared by Bedrock S.A., Bedrock Monaco SAM, and Bedrock Asset Management (UK) Ltd. (jointly, hereafter, “Bedrock”).
The information and opinions contained in this document are for background information and discussion purposes only and do not purport to be full or complete. No information in this document should be construed as providing financial, investment or other professional advice.
The information contained herein is intended for the sole use of the recipient and may not be copied or otherwise distributed or published without the express consent of Bedrock. Although the information contained herein has been established by Bedrock based on or by reference to sources, documents and systems it believes to be reliable and accurate, Bedrock does not guarantee its accuracy or completeness and assumes no responsibility for any losses that may arise from the use of this information.
Information included in this document is intended for those investors who meet the definition of Professional Client under the Swiss FinSA regulation as well as Professional Client or Eligible Counterparty under the UK Financial Conduct Authority.
Confidentiality
This presentation and the information contained herein are confidential. Each copy of this presentation is addressed to a specifically named recipient and shall not be passed on to a third party. By its acceptance hereof, the recipient agrees to keep the presentation and its contents strictly confidential and may not disclose or divulge any information contained herein to any other person. This presentation cannot be published, copied, reproduced or distributed in any manner whatsoever. The recipient will use this presentation for the sole purpose of obtaining a general understanding of the business, operations and financial performance of Bedrock in order to make a decision as to whether the recipient should proceed with a further investigation of the Funds and this investment opportunity. Bedrock reserves the right to request the return of this presentation at any time, without the retention of any copies by the prospective investor.
Investment Risks
The value of all investments and the income derived therefrom can fluctuate due to market movements and you may not get back the amount originally invested. In the case of overseas investments, values may vary as a result of changes in currency exchange rates. This may be due, in part, to exchange rate fluctuations in investments that have an exposure to currencies other than the base currency of the portfolio. Past performance is no guide to or guarantee of future performance.
Limitation of Liability and Indemnity
Bedrock expressly disclaims liability for errors or omissions in the information and data contained in this document. No representation or warranty of any kind, implied, expressed or statutory, is given in conjunction with the information and data. Bedrock accepts no liability for any loss or damage arising out of the use or misuse of or reliance on the information provided including, without limitation, any loss of profits or any other damage, direct or consequential. You agree to indemnify and hold harm less Bedrock and its affiliates, and the directors and employees of Bedrock and its affiliates from and against any and all liabilities, claims, damages, losses or expenses, including legal fees and expenses arising out of your access to or use of the information in this presentation, save to the extent that such losses may not be excluded pursuant to applicable law or regulation. Any opinions contained in this presentation may be changed after issue at any time without notice.
Copyright and Other Rights
The copyright, trademarks and all similar rights of this presentation and the contents, including all information, graphics, code, text and design, are owned by Bedrock.
European defence stocks have soared since Donald Trump’s return to the White House. In this article, our Research Team explores how European defense equities are gearing up for increased investment and growth opportunities in the evolving security landscape.
This month we discuss the market volatility in March, the new US tariffs—both implemented and announced, developments in the Russo-Ukrainian war, the latest economic data, and the outlook for the almighty US dollar.
This month we discuss the violent equity rotation from the US and growth to Europe, EM, and value, America’s hard-line trade revisionism, falling bond yields, and developments in Ukraine.